
Bathymetry Technique
Seasonal bathymetric surveys were conducted utilizing a sonar transducer, producing detailed bathymetric maps with 1 m contour spacing. This high‐resolution representation of the nearshore environment enables ACE to quantify changes in seafloor morphology over time and better understand the underwater topography of the study area (Figure 9).
All four planned seasonal field surveys have now been completed. The first survey took place in January, followed by the second in May, the third in August, and the fourth in November. Sampling periods were strategically spaced throughout the year to capture seasonal variability in beach and nearshore morphology, allowing the assessment of how weather patterns and wave conditions influence beach profile evolution across seasons.
Each full transect profile includes elevation measurements from the mean sea level contour landward to the developed shoreline boundary, representing the backing infrastructure, as well as bathymetric data seaward of the shoreline. During field surveys, corrections to bathymetry were applied to account for instantaneous wave elevation at the time of measurement. Transect locations and examples of completed profiles are presented in Figure 9 and Figure 10, respectively.
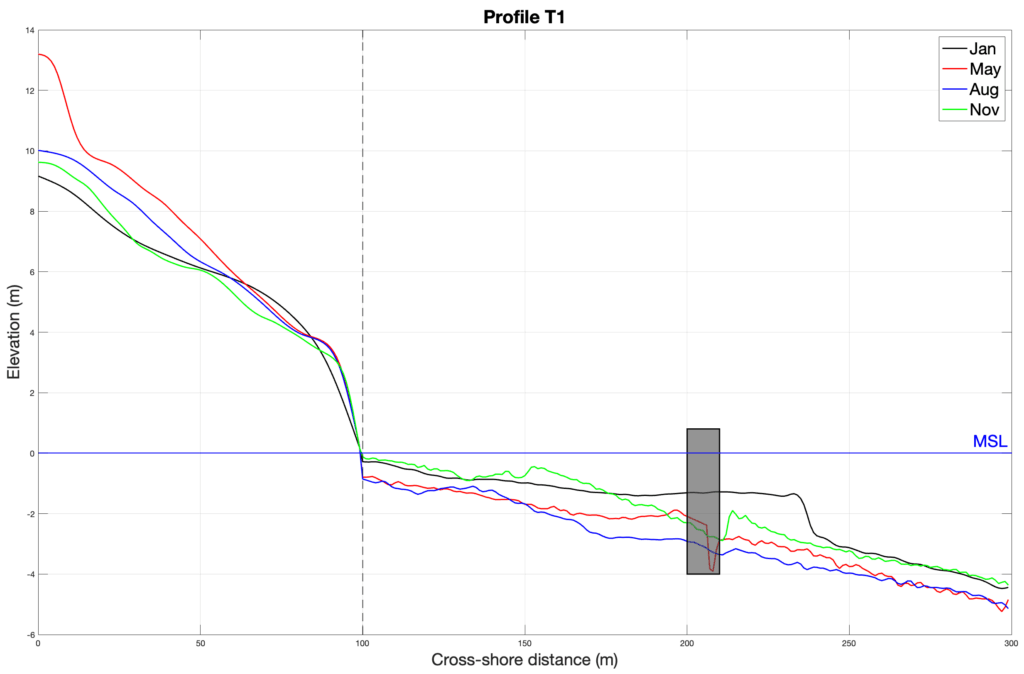
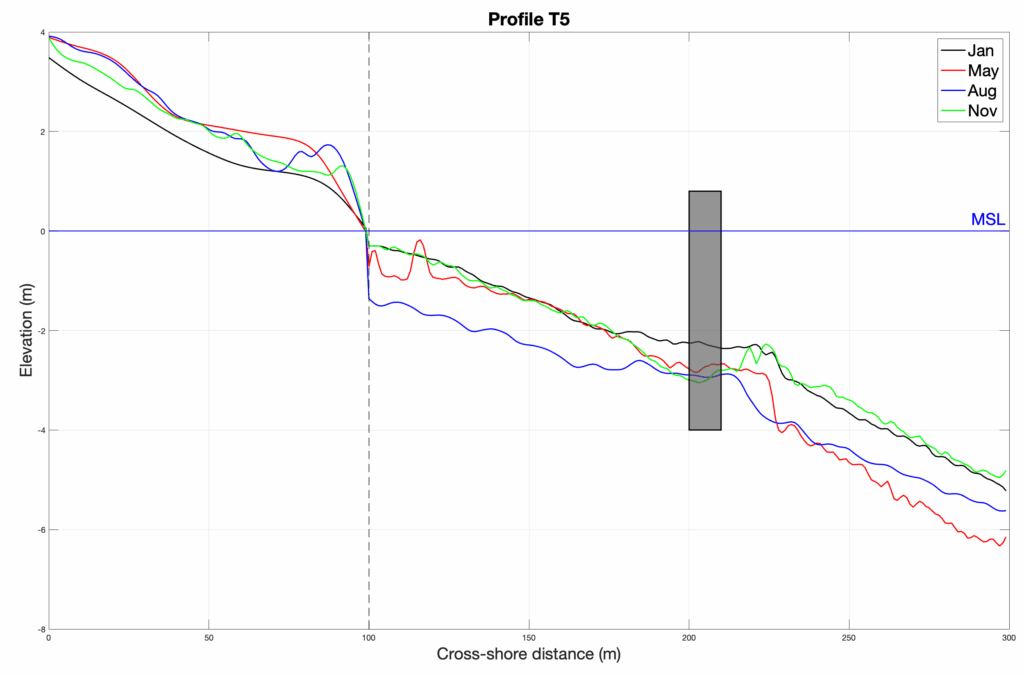
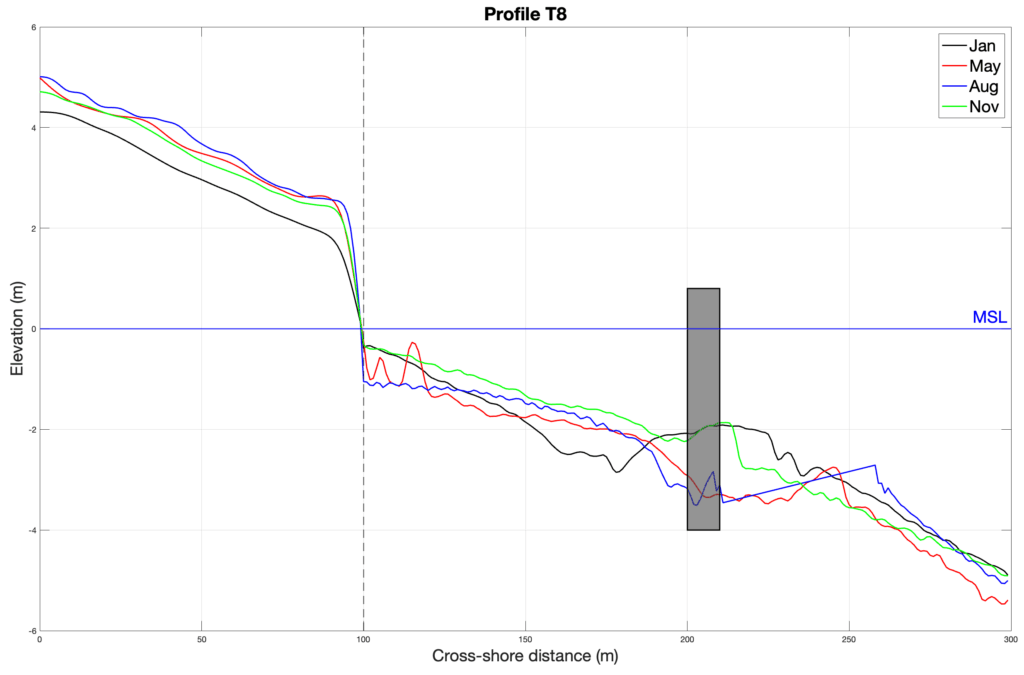
Figure 10: Examples of seasonal beach profiles derived from four field surveys. Positive elevations represent subaerial beach morphology, while negative elevations indicate the nearshore bathymetry relative to mean sea level (MSL; blue line). The dashed vertical line marks the shoreline position at approximately 100 m cross-shore distance. The shaded grey rectangle denotes the location of the offshore breakwater, which has a crest elevation of +0.8 m above MSL and a total structure length of 100 m.